
This dashboard was developed for our quarterly reporting to department leadership. I implement strategic metric tracking in our project management platform to automatically pull and generate these data visualizations.
Transparent Data Tracking
The logic to these metrics follows a simple taxonomy that supports our strategic marketing plan:
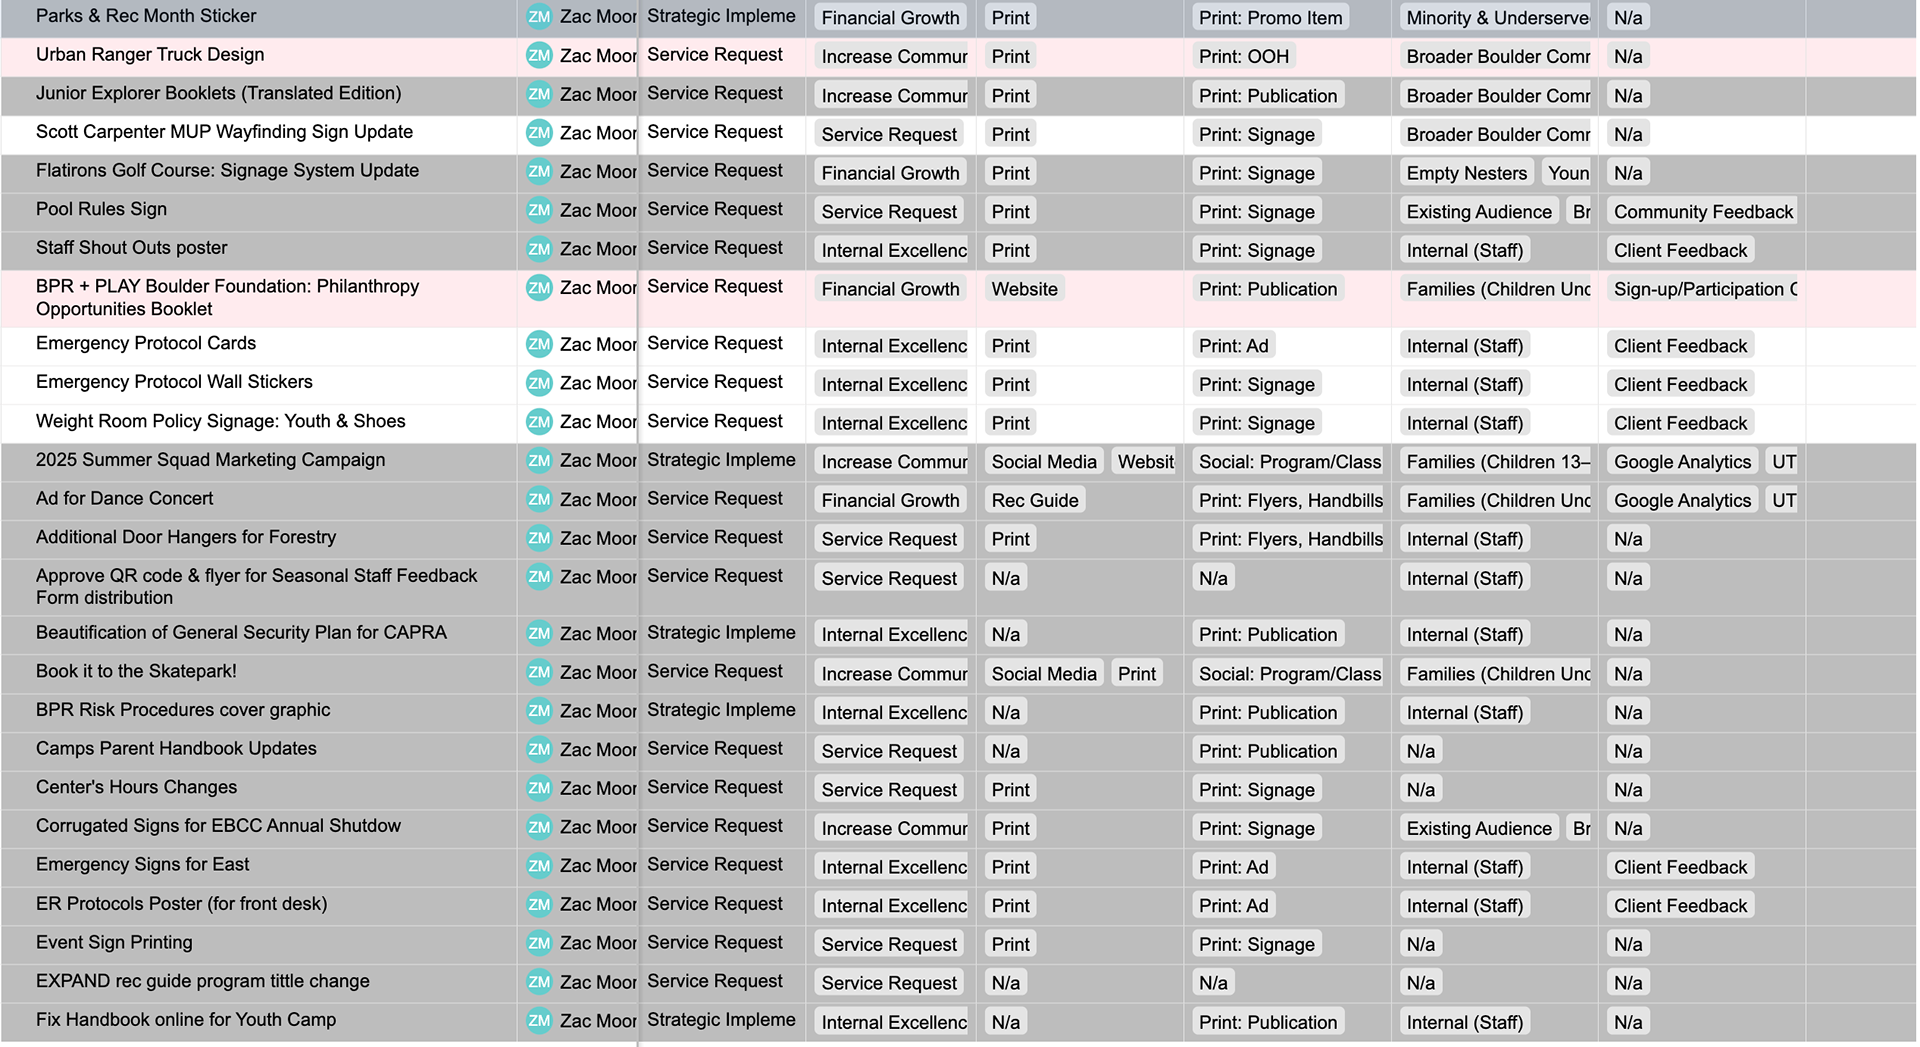
I. Operational Function
The first metric is designed to track our day-to-day projects and tasks as they relate to our three operational functions: Service Requests, Strategic Implementations, and Internal Maintenance projects.
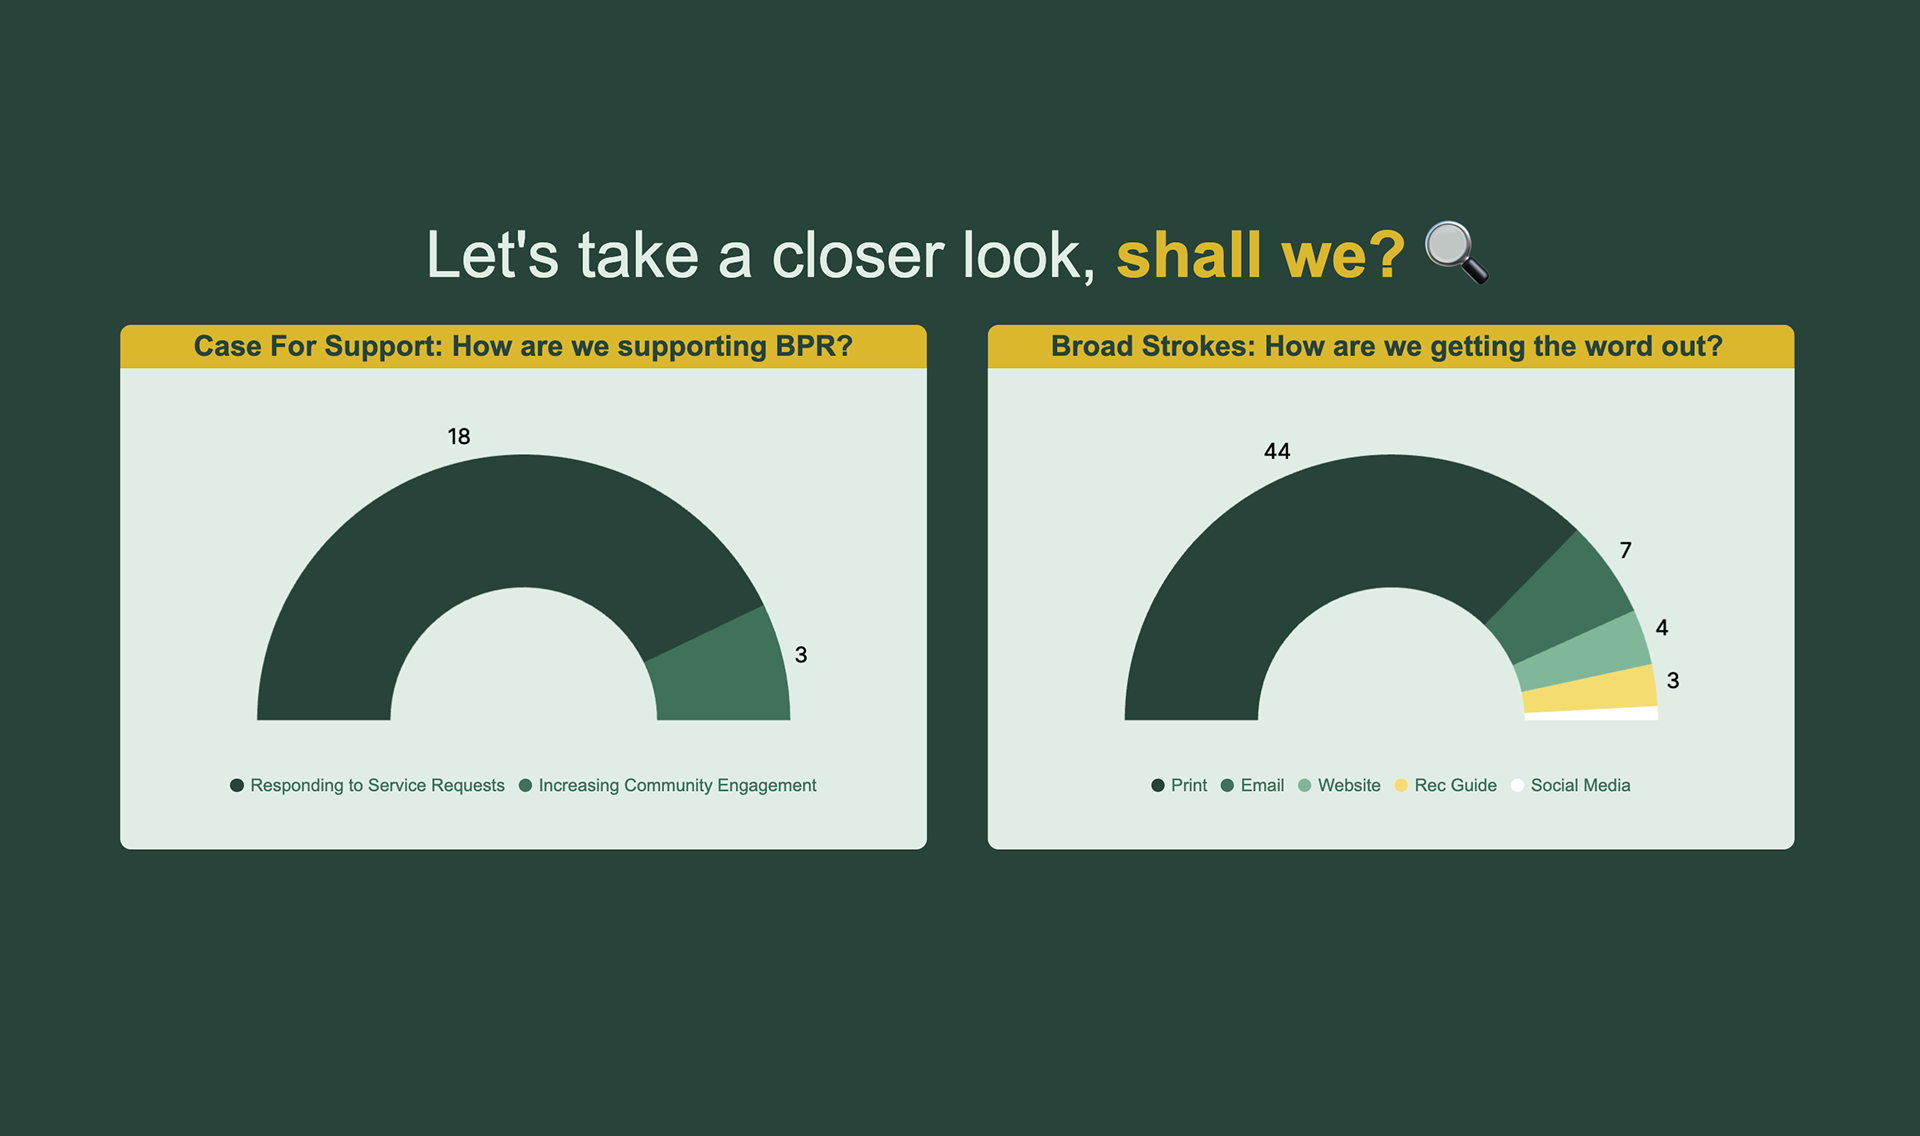
II. Brand Alignment
The second metric tracks how we're supporting our brand pillars: financial growth, increasing community engagement, addressing ongoing service requests, and DEI efforts across the organization.
III. Tactics, Audience, Evaluation Methods
The final metrics track the granular "in the weeds" details of our project work. Not information that most people need, but a transparent break down of where are dollars and efforts are being spent.


Humanizing cold, hard data.
By incorporating narrative text within this reporting dashboard, we season bland status updates with the human experience. It goes beyond just sharing numbers—it allows us a chance to tell a story (and a compelling one at that).
We also decided to incorporate a "bragging rights" section. Each of us contributes projects or success stories that might go unseen by our strategic leadership team—providing each of us with visibility for the projects and experiences that make our work personal.